Understanding Google Analytics: A Beginner’s Guide
At the Design Thinking Agency’s blog, we aim to demystify the digital landscape and empower marketers with the knowledge they need to succeed. In this article, we’ll delve into the world of Google Analytics – a powerful tool that can revolutionize how you approach marketing strategies.
What is Google Analytics?
Google Analytics is a web analytics service offered by Google that allows you to track and analyze website traffic. In simpler terms, it’s a valuable source of insights into how users interact with your website. Google Analytics provides a comprehensive overview of your online performance, from the number of visitors and page views to the average time spent on your site.
How to Use Google Analytics
1. Set Up Your Account: The first step is to create a Google Analytics account and set up a property for your website. Google will provide you with a unique tracking code that needs to be integrated into your website. This code allows Google Analytics to collect data and generate reports.
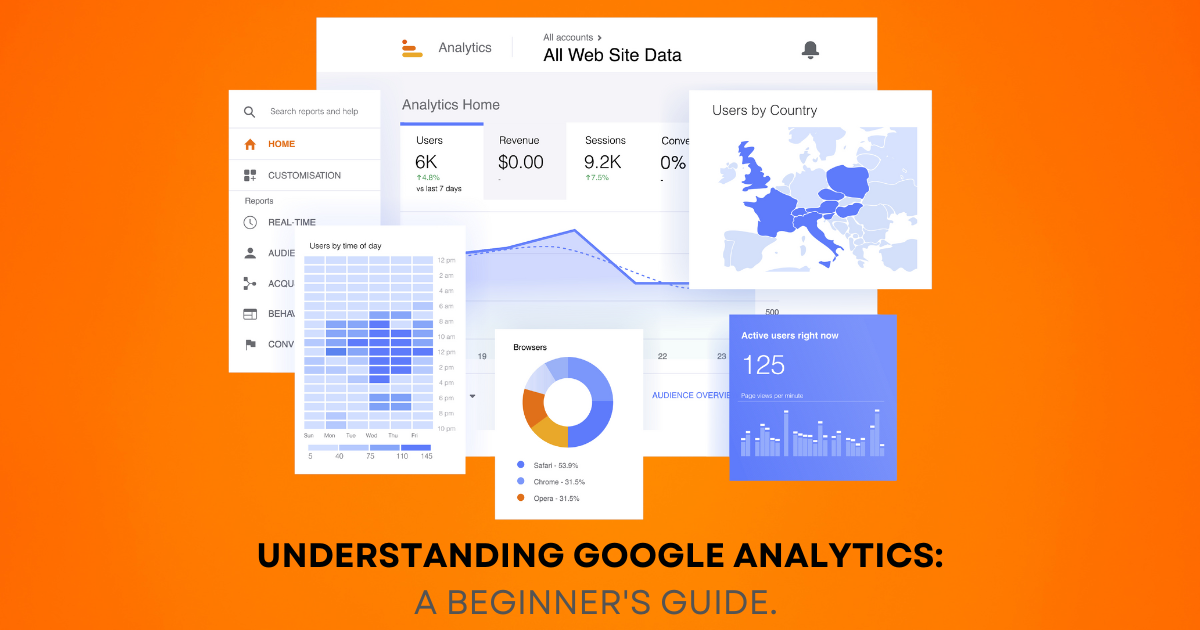
2. Navigate the Dashboard: Once your account is set up, you’ll be greeted with a dashboard showcasing key metrics. Familiarize yourself with terms like sessions, users, and bounce rate. These metrics offer insights into the quantity and quality of your website traffic.
3. Explore Reports: Google Analytics offers a variety of reports, each providing unique insights. Dive into the Audience report to understand your visitors, the Acquisition report to track traffic sources, and the Behavior report to analyze user engagement on your site.
4. Set Goals: Define your business objectives and set up goals within Google Analytics. Whether it’s lead generation, e-commerce transactions, or content engagement, goals help you measure the success of your online endeavours.
How to Understand Analytics
1. Interpret Key Metrics: Understanding metrics such as bounce rate, conversion rate, and average session duration is crucial. The bounce rate indicates the percentage of visitors who navigate away from your site after viewing only one page. Conversion rate, on the other hand, measures the percentage of users who complete a desired action. (Check out our Digital Marketing Dictionary blog for more details on common metrics and what they mean)
2. Segment Your Data: Segmentation allows you to break down data into specific categories, enabling a more nuanced analysis. Explore demographics, devices, and user behaviour to identify patterns and tailor your marketing strategies accordingly.
3. Monitor Trends Over Time: Regularly analyze trends and patterns in your data. Are there certain days or times when your website sees a spike in traffic? Identifying these trends can help you optimize your content and promotional activities for maximum impact.
What to Do with Analytic Results
1. Optimize User Experience: Use analytics to identify areas of your website that need improvement. If users are bouncing off a particular page, it’s a signal to reassess its content, layout, or functionality.
2. Refine Marketing Strategies: Identify which marketing channels are driving the most traffic and conversions. Allocate your resources strategically based on the data, focusing on channels that yield the best results.
3. Make Informed Decisions: Ultimately, Google Analytics equips you with the information needed to make informed decisions. Whether it’s tweaking your website design, refining your content strategy, or adjusting your advertising budget, analytics guides your marketing efforts toward success.
Google Analytics isn’t just a tool; it’s your digital compass, guiding you through the vast terrain of online marketing. Embrace its power, analyze the data, and let it shape your journey towards digital success. Contact our team for more information about using Google Analytics, or to help get you started.